QSAT Communications
Conceptual performance-analysis workstation with network visualizations, not a QSAT facility or software product
Performance Intelligence & Analytics

Performance Reporting & Analytics

Turn Infrastructure Performance Data into Actionable Insights

Gain a clearer understanding of network and infrastructure performance through structured reporting, trend analysis, KPI visibility, and capacity insights. QSAT helps organizations make more informed operational and technology decisions using the performance data available across their environments.

Performance visibilityHistorical trendsCapacity insightsConceptual analytics visual
Why performance reporting matters

Bring Fragmented Performance Data into Focus

Network and infrastructure information is often spread across devices, sites, monitoring tools and operational teams. Different measurement periods, incomplete histories and inconsistent definitions can make the bigger picture difficult to interpret.

Structured reporting brings supported evidence into a consistent operational view. It helps teams communicate technical performance, review recurring issues and establish measurable objectives rather than relying on isolated alerts or impressions.

  • Understand performance across monitored infrastructure
  • Review availability and connectivity trends
  • Identify recurring incidents and degradation patterns
  • Compare utilization across reporting periods
  • Identify potential capacity constraints
  • Support lifecycle and investment decisions
  • Communicate findings to management and stakeholders

Dashboards alone do not improve performance. Their value depends on reliable data, suitable coverage, consistent metrics, careful interpretation and effective follow-up.

  1. Supported data sources

    Devices · Monitoring platforms · Infrastructure exports

  2. Consistent performance evidence

    Validated samples · Agreed KPIs · Comparable periods

  3. Reporting and interpretation

    Operational summaries · Trends · Capacity observations

  4. Informed follow-up

    Investigation · Assessment · Stakeholder review

Illustrative information flow, not a QSAT analytics platform. Each stage depends on available data and agreed responsibilities.
Reporting and analytics explained

Communicate What Happened. Understand the Patterns.

Reporting creates a shared record. Analytics adds context to that record so teams can ask better questions and evaluate appropriate next steps.

Performance reporting

The structured presentation of collected performance data, operational metrics, events and trends over an agreed period. Availability summaries, bandwidth utilization, incident reports and capacity observations help communicate what happened.

Performance analytics

The examination of data to compare periods, identify anomalies, review repeated degradation and assess possible resource constraints. It helps investigate why patterns may be occurring and what action may be appropriate.

Correlation does not prove causation. Identifying root causes requires sufficient evidence and may need additional diagnostics or specialist investigation.

Network performance analytics

See Beyond the Current State of Your Network

Historical indicators help explain network behaviour over time. Select capabilities around business priorities and supported telemetry—not an assumption that every device exposes every metric.

Availability and uptime reporting

Summarize the observed availability of monitored devices, links and services over a defined period. Review interruptions in context rather than relying on a single headline figure.

Requires agreed reachability rules, monitoring coverage, complete samples and documented exclusions.

Latency and packet-loss analysis

Review changes in connection quality over time to identify degradation patterns and guide investigation of affected paths.

Depends on suitable measurement endpoints, sampling methods and supported performance probes.

Bandwidth and utilization analytics

Compare sustained usage, recurring peaks and changing traffic patterns to identify potential capacity requirements.

Requires historical counters, consistent collection intervals and known link-capacity definitions.

Interface and device performance

Examine supported interface errors, device-health indicators and counter trends to identify components that warrant attention.

Available metrics depend on device capabilities, permissions and telemetry exposed by the equipment.

WAN and multi-site performance

Compare supported connectivity indicators across offices, remote facilities and inter-site links to prioritize investigation.

Sites need comparable metric definitions, measurement context and aligned reporting periods.

SD-WAN performance visibility

Review supported link measurements, availability and network-path behaviour alongside changes in connectivity conditions.

Access depends on the SD-WAN platform, licensing, historical data and approved integrations.

Connectivity trend analysis

Distinguish isolated events from recurring patterns by reviewing comparable periods and recording changes to the network.

Meaningful comparisons require sufficient retained history and awareness of topology or monitoring changes.


Infrastructure performance reporting

Connect Network Evidence with Resource Context

Reporting can extend beyond WAN links to supported enterprise devices and data centre connections. Where relevant telemetry is available, compute utilization, memory demand, storage capacity and selected performance indicators can contribute to an infrastructure review.

Each category requires suitable monitoring, approved integration and agreed definitions. Connectivity between components and selected service-availability measurements should be considered alongside resource trends so findings retain their operational context.

Infrastructure reporting is not automatically comprehensive application performance management, database analytics, cloud cost management, security analytics or facilities management. Those capabilities require explicit confirmation and separate scope.

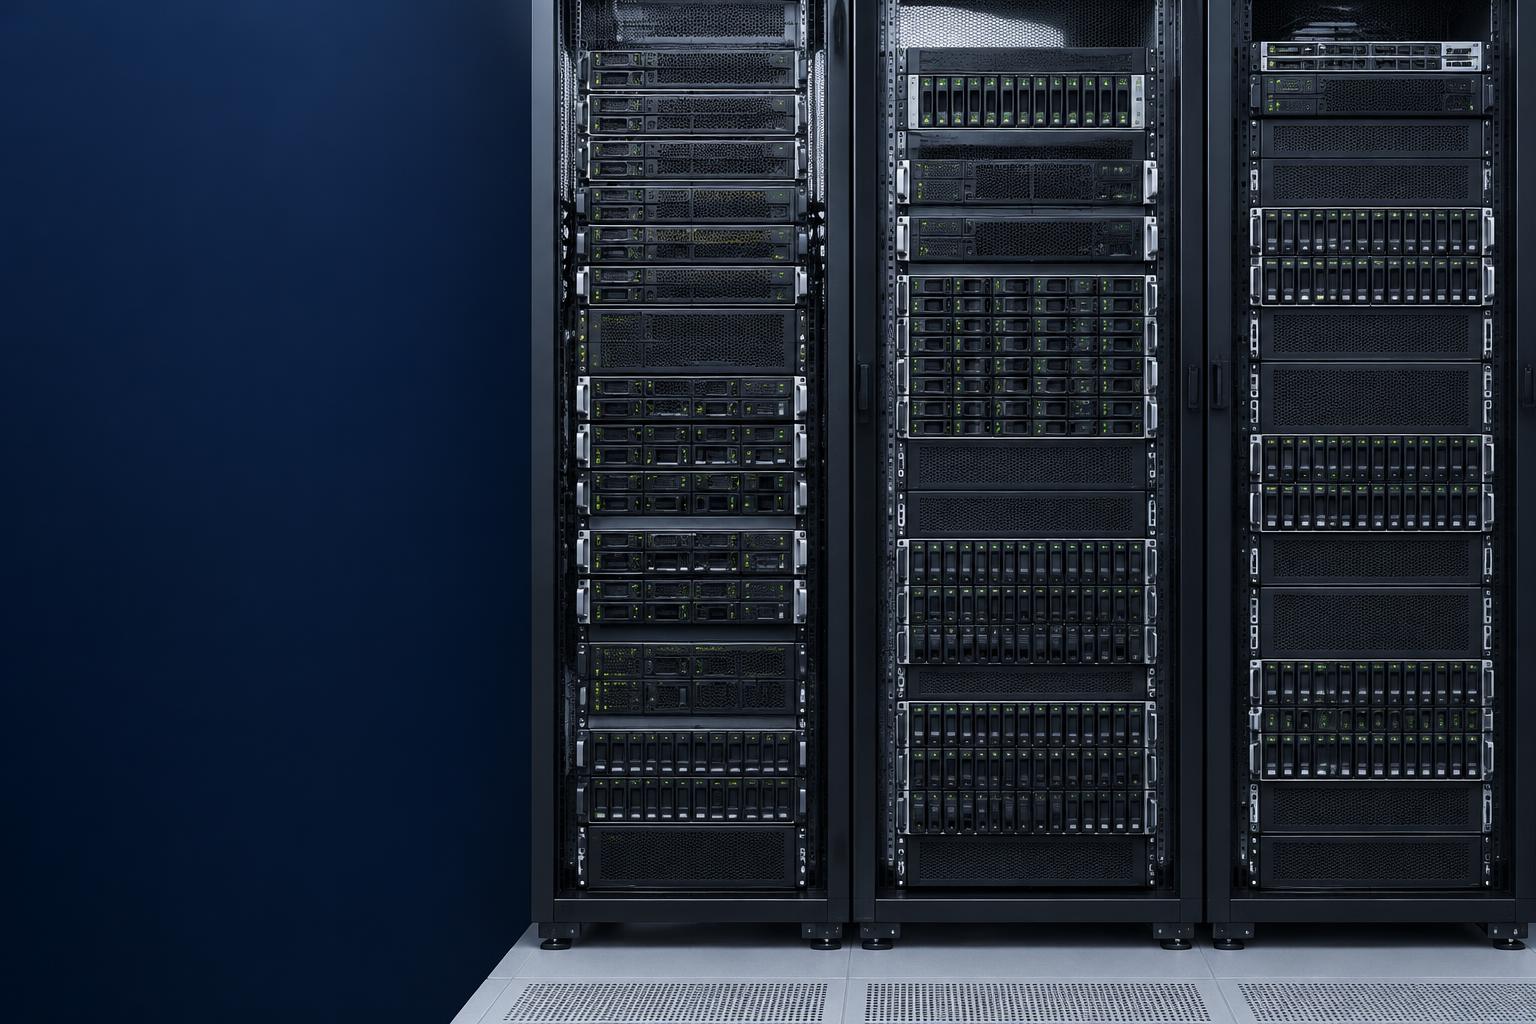
Enterprise compute and storage infrastructure supporting workload and capacity assessments
  • Enterprise network devices and data centre networks
  • Supported compute and server utilization
  • Storage capacity and performance where available
  • Connections between infrastructure components
  • Selected infrastructure service availability
  • Resource demand and capacity trends
Executive dashboards and KPI visibility

The Right Level of Detail for Every Stakeholder

Role-appropriate reporting helps technical teams and business leaders work from a consistent interpretation of performance. The presentation should follow stakeholder needs rather than a one-size-fits-all dashboard.

Executive-level reporting

Concise summaries of selected KPIs, significant incidents, trends, capacity concerns and follow-up priorities support management discussions.

IT management views

Infrastructure health, connectivity performance and recurring issues provide context for operational planning and resource decisions.

Network operations reporting

Detailed device and link measurements, event history and troubleshooting indicators support technical review where the data exists.

Multi-site performance views

Consistent reporting periods and definitions allow teams to compare supported indicators across locations and identify areas for investigation.

Agree KPI definitions, sources, units, thresholds and reporting periods. Dashboard access and functionality depend on available tools and engagement scope; no proprietary QSAT portal is implied.

Operational KPIs and performance metrics

Measure What Matters to Your Environment

Select indicators according to business objectives, infrastructure and data availability. A meaningful metric includes its measurement context—not just a value.

Possible reporting indicators; metric availability and interpretation must be confirmed.
MetricWhat It ShowsHow It Can Help
AvailabilityWhether devices or links were reachable under defined monitoring rules.Review service interruptions and affected periods with agreed exclusions.
LatencyMeasured travel time between relevant network endpoints.Identify changes in connection responsiveness for further investigation.
Packet lossPackets that fail to arrive within a measured sample.Review recurring connectivity-quality issues and affected paths.
Bandwidth utilizationHow much of a link's available capacity is being used.Recognize sustained demand and assess potential capacity needs.
Interface errorsSupported interface counters indicating errors or abnormal conditions.Identify devices or connections that may need diagnostics.
Incident frequencyRecorded incidents within a defined reporting period.Understand the distribution of operational events over time.
Recurring incident patternsRepeated issues involving particular components, links or locations.Focus operational reviews on persistent conditions.
Resource utilizationUse of supported compute, memory, storage or other monitored resources.Assess workload demand in the context of available resources.
Capacity trendsChanges in usage that may indicate future resource requirements.Inform planning alongside growth expectations and engineering assessments.
Performance threshold eventsOccasions when measured indicators exceed agreed limits.Review deviations and whether thresholds remain appropriate.

Not every KPI is appropriate for every environment. This framework contains no QSAT target values, uptime commitments, MTTR results or performance benchmarks.

Trend analysis and anomaly identification

Distinguish One-Off Events from Recurring Patterns

Historical evidence gives isolated measurements context. Compare current and previous periods, review recurring bandwidth peaks and observe gradual changes in resource consumption before deciding what warrants attention.

Repeated degradation at a particular link or site may justify further investigation. Changes in supported indicators can also be examined alongside recorded infrastructure events, with care not to mistake coincidence for cause.

  • Compare equivalent reporting periods
  • Review recurring utilization peaks
  • Observe gradual resource-demand increases
  • Identify unusual indicator changes
  • Examine recurring incidents by site or link
  • Investigate possible relationships with recorded events

Depending on available tools and data, anomaly identification can use thresholds, historical patterns or analytical methods. AI-powered prediction and machine-learning capabilities are not assumed.

Illustrative trend — no measured customer data
Conceptual utilization trend across reporting periodsA non-numeric line shows recurring usage peaks and gradually rising demand. This is illustrative only, not QSAT or customer performance.Earlier periodsLater periods
Recurring peaks and a rising baseline can prompt a capacity review. Collection changes, workloads and seasonal demand need to be considered before drawing conclusions.
Capacity planning and resource optimization

Plan Infrastructure Changes with Better Evidence

Performance history helps frame future requirements. Combine utilization trends with workload criticality, business growth and engineering context before making investment decisions.

01

Network capacity planning

Historical link utilization and traffic patterns help assess whether additional bandwidth, configuration changes or traffic-management measures warrant evaluation.

02

Compute and storage planning

Where suitable data exists, review server resources, memory demand, storage capacity and workload patterns before proposing changes.

03

Growth and expansion

Combine observed utilization with expected business growth, new sites and changing workloads to inform future infrastructure requirements.

04

Bottleneck investigation

Compare related metrics and historical observations to identify components requiring deeper diagnostics. A high reading alone is not proof of a bottleneck.

05

Infrastructure lifecycle

Use performance history to support discussions about upgrades, refreshes, consolidation and replacement in the context of operational needs.

06

Cost-conscious decisions

Reliable utilization information can help evaluate resource allocation and avoid decisions based solely on assumptions.

Analytics supports planning; it does not guarantee cost savings, predict demand with certainty or replace an engineering assessment.

Incident reporting and operational reviews

Turn Recorded Events into a Useful Operational Record

Incident summaries and event timelines help operational meetings move from recollection to recorded evidence. Review the frequency, distribution and apparent impact of incidents alongside available performance measurements before and after an event.

Where recorded, affected devices, links and locations, escalation status and outstanding actions provide continuity between technical teams and management. Evidence-based recommendations can identify issues for further troubleshooting or provider escalation.

Incident reporting is distinct from incident response. Reporting documents and analyses events; resolution depends on responsible teams, authorized access and the agreed operating model.

  • Incident summaries and event timelines
  • Frequency and distribution of recorded incidents
  • Recurring connectivity and performance issues
  • Identifiable affected devices, links and locations
  • Recorded escalation and follow-up status
  • Performance changes before and after incidents
  • Outstanding investigations and remediation actions
  • Evidence-supported recommendations
Distributed and connectivity-dependent environments

Understand Performance Across Sites and Network Paths

Distributed offices, remote facilities, satellite-connected sites and maritime operations bring different measurement conditions and connectivity dependencies. Uneven visibility can make comparisons difficult when data sources or observation points differ.

Consistent reporting can bring supported WAN and satellite-link information into a shared review: availability, latency, packet loss, utilization, recurring site issues and performance differences across available paths.

Reports help prioritize investigation across locations; they do not imply direct access to every satellite terminal, carrier, maritime system or third-party platform.

Satellite connectivity equipment for distributed and remote operations
From reporting to recommendations

A Practical Cycle from Evidence to Follow-Up

Useful analytics connects an observation to a considered next step. Keep assumptions visible and revisit later periods to understand whether conditions have changed.

  1. 01

    Collect

    Gather data from agreed monitoring systems and supported infrastructure.

  2. 02

    Validate

    Review completeness, consistency and metric definitions.

  3. 03

    Analyze

    Examine trends, deviations, recurring issues and utilization.

  4. 04

    Interpret

    Assess possible impact and identify questions for investigation.

  5. 05

    Recommend

    Document evidence-based actions or areas for further assessment.

  6. 06

    Review

    Compare subsequent periods and evaluate changes.

Recommendations may include further troubleshooting, a capacity assessment, monitoring adjustments, an infrastructure review or escalation to a responsible provider. Engineering changes, remediation and implementation are not automatically included.

Frequency, formats and stakeholder needs

Reporting Designed Around Your Operational Priorities

Define frequency and presentation around the decisions stakeholders need to make. Technical teams may need detailed metrics, event timelines and device-level evidence. Management may prefer concise summaries of significant issues, risks, trends and priorities.

Periodic summaries, incident-specific reviews and capacity reports serve different purposes. Weekly or monthly operational reports may be appropriate where agreed; dashboard views depend on supported tool capabilities.

Confirm reporting channels, historical retention, templates, access and review meetings as part of the engagement. A specific portal, automatic delivery, real-time dashboard or fixed frequency is not assumed.

  • Periodic performance summaries
  • Weekly or monthly operational reports where agreed
  • Incident-specific reports
  • Capacity and utilization summaries
  • KPI dashboards where supported
  • Management review presentations
  • Trend analysis and scoped recommendations
Integration and data requirements

Reliable Insights Start with Reliable Inputs

Before defining a reporting service, establish what can be measured, accessed and compared. Reporting quality depends on data availability, reliability, monitoring coverage and appropriate interpretation.

Data sources

Identify relevant monitoring systems, network devices, infrastructure platforms and existing operational reports.

Metric availability

Confirm which indicators are exposed, the available collection intervals and whether sufficient historical data exists.

Data consistency

Agree naming conventions, units, reporting periods, thresholds and availability definitions so comparisons remain meaningful.

Access and integrations

Assess approved protocols, APIs, exports and platform capabilities for technical feasibility. Compatibility is not assumed.

Data quality

Account for missing samples, inconsistent timestamps, incomplete coverage and changes to infrastructure or collection methods.

Privacy and access control

Define permissions, data ownership and handling requirements for potentially sensitive operational information.

Report validation

Check selected metrics and sample reports against the available source information before using them for operational decisions.

No universal compatibility is implied. Assess each third-party platform, protocol and integration before treating its information as an available QSAT reporting capability.

How a reporting engagement works

Define the Questions Before Designing the Reports

  1. 01

    Understand the environment

    Review infrastructure, topology, objectives, stakeholders and existing monitoring arrangements.

  2. 02

    Define performance objectives

    Identify relevant KPIs, periods, components and the operational questions reports should answer.

  3. 03

    Assess data availability

    Confirm coverage, telemetry, retained history, integration needs and limitations.

  4. 04

    Develop reporting and analysis

    Establish the agreed reporting structure, prepare summaries and analyze available evidence.

  5. 05

    Review insights and next steps

    Discuss findings, identify issues requiring investigation and document agreed follow-up actions.

The exact process depends on environment size, complexity, data readiness and engagement scope. No fixed delivery or implementation timeline is implied.

Discuss Your Reporting Requirements
Security, governance and data integrity

Trustworthy Reporting Requires Controlled Access

Reports can reveal sensitive operational information. Restrict access to authorized stakeholders, protect monitoring credentials and configuration details, and obtain customer approval for exports or integrations where required.

Consistent methodology and documented assumptions help readers understand the strength and limitations of findings. Maintain traceability to available source data and define ownership of reports and retained history.

Appropriate security and governance arrangements should be agreed for the environment. No QSAT certification, regulatory alignment or formal governance framework is asserted here.

  • Appropriate operational-data permissions
  • Secure, approved monitoring access
  • Protection of credentials and configuration information
  • Consistent KPI definitions and methodology
  • Clear data and report ownership
  • Documented assumptions and limitations
  • Traceability of findings to source evidence
  • Agreed retention and information handling
  • Customer approvals for access, exports and integrations
Who can benefit

Performance Insight for Technical and Business Teams

01

Enterprise IT teams

Understand network and infrastructure performance, identify recurring issues and support operational planning.

02

Network operations teams

Review link performance, connectivity trends, incident patterns and utilization across supported environments.

03

Data centre operators

Analyze supported network, compute and storage indicators to inform infrastructure planning.

04

Multi-site organizations

Compare locations using consistent definitions and identify sites or links requiring further investigation.

05

Connectivity-dependent environments

Review supported telecommunications and remote-connectivity metrics alongside historical performance trends.

06

IT leadership and infrastructure managers

Translate technical evidence into concise performance summaries and informed planning discussions.

Why QSAT

Infrastructure Context Behind the Performance Story

QSAT's connectivity and infrastructure focus provides context for performance reporting across supported network and technology environments. The objective is useful, interpretable evidence aligned with business priorities—not more metrics for their own sake.

Connect historical trends and recurring operational issues with capacity discussions, infrastructure reviews and clear stakeholder communication. Reporting complements the wider QSAT portfolio while retaining explicit data and responsibility boundaries.

  • Reporting aligned with infrastructure and business objectives
  • Useful, interpretable performance indicators
  • Supported network and connectivity visibility
  • Historical trends and recurring issue context
  • Capacity planning and infrastructure-review support
  • Structured communication between technical and management teams
  • Alignment with wider QSAT infrastructure solutions
Frequently asked questions

Performance Reporting: Your Questions Answered

Discuss your performance priorities

Make Better Infrastructure Decisions with Performance Insights

Understand your network and infrastructure performance with reporting designed around your operational priorities. Discuss your KPIs, monitoring data, reporting needs, and capacity-planning objectives with QSAT.

1